metrics for free: alembic <3 prometheus
disclaimer: this makes use of certain features only available in alembic ops, the commercial layer on top of alembic.
if you are an alembic user, you probably have a lot of devices to
keep track of. and in that case, you’re interested in knowing the status
of said devices; like their cpu usage, io rate, or their amount of free
memory. prometheus is an excellent and popular tool for
collecting such metrics, but it can be cumbersome to set up; you need to
configure it with the ip addresses of all the devices to monitor, and if
anything changes you need to make sure the configuration is kept up to
date. since alembic already can keep track of your complete inventory
(with a backend-agnostic representation) it can be used to solve this
problem in a very neat and convenient way. in the following post we’re
going to look at how to do this in practice!
step 1 - importing your data
first of all we have to make sure that all the information about your system is up to date. perhaps you already have it stored in a file with alembic ir. if not, we can generate such a file by importing the data from your backend. in this example we’re using netbox, but this could of course be any of the dcim systems that alembic has adapters for.
$ alembic import --backend netbox -f schema.yaml -o ir.yamlif you want to use the same schema as the one used when writing this
article, get it here.
step 2 - transforming the data
looking at the ir and its objects, we can see that each device has the following kind of field:
"primary_ip4": "30000000-0000-0000-0000-000000000002"this is a reference to an ip address object, because that’s how
netbox organizes its data. what the prometheus adapter wants is a
literal ip address (e.g. “165.10.20.3”) stored in a field called just
primary_ip. we also need to use this ip as the primary key
for the devices, rather than relying on its name.
since we’re in alembic territories now though, we are free to
transform this data as we see fit. the main way to do such things is
through the map command. it takes one or more
transformation rules and applies those to the matching objects in the
ir, producing a new file. we will use a ready-made file with
transformations called resolve.yaml and
apply it like so1:
$ alembic map -f ir.yaml --spec resolve.yaml -o resolved.jsonnow, the object from above (i.e. the one that has the exact same uid) contains a field that looks like this instead:
"primary_ip": "198.51.100.102"the primary keys on the devices also have changed:
"key": {
  "primary_ip": {
  "type": "string",
  "required": false,
  "nullable": false
  }
},
step 3 - generating the prometheus configuration
with the data in the correct shape, we’re ready to run the prometheus
adapter (first make sure that its binary is located somewhere on your
machine). to make it extra easy to run, we put its configuration into
our plugins directory, in a file named
prometheus.yaml:
backend: external
command: path/to/alembic-adapter-prometheus
args: []
env: {}
timeout_seconds: 10
setup:
  out_path: ./out/targets.json
  rules_path: ./out/rules.yml
  config_path: ./out/prometheus.yml
now we can run it just like a built-in adapter, first generating a plan and then applying it:
$ alembic plan --backend prometheus -f resolved.json -o plan.json$ alembic apply --backend prometheus --plan plan.jsonthis emits three configuration files required by prometheus;
targets.json, rules.yml &
prometheus.yml.
step 4 - start prometheus
we’re ready to collect metrics from the devices. given that prometheus has been installed on our machine, we can run it with the configuration emitted by alembic:
$ prometheus --config.file=./out/prometheus.ymlafter booting up, we can go to http://localhost:9090 in
a web browser to inspect the metrics as they are collected. to learn
more about how prometheus queries work, see their documentation.
step 5 - visualize using grafana
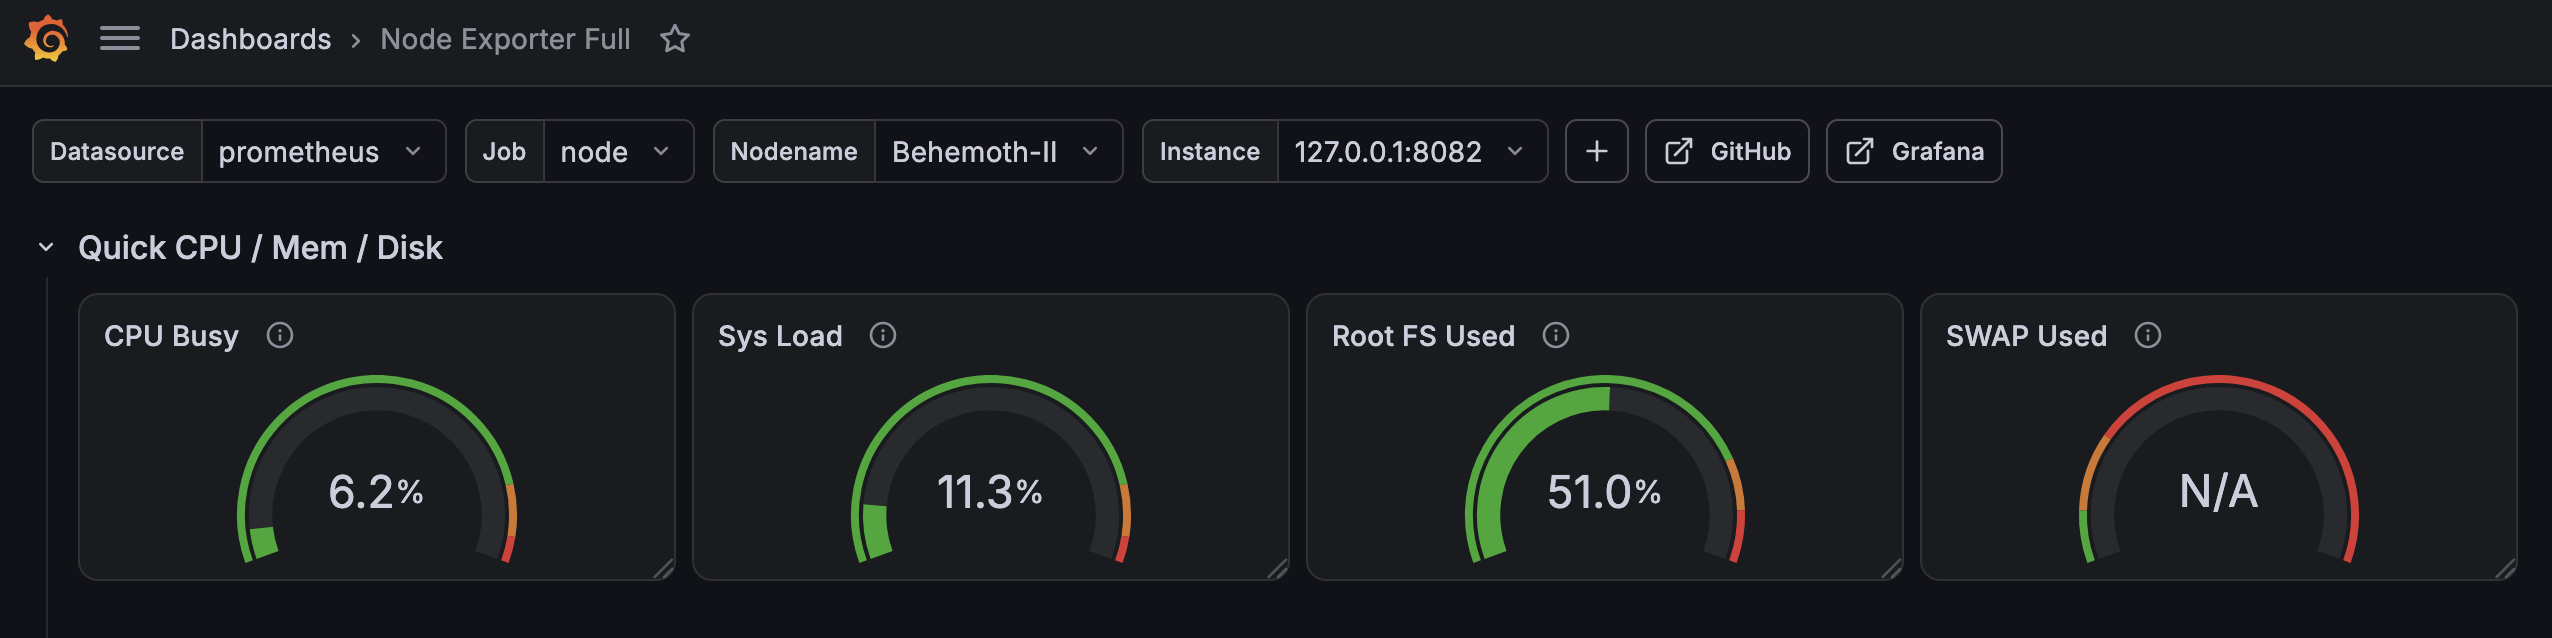
to get a nice dashboard (worthy of your sci-fi movie of choice) we turn to grafana. to not have to manually set up various common widgets like graphs and gauges, the recommended way is to download the interface file (a json file) for something like “Node Exporter Full” from the grafana dashboard collection. inside the grafana web interface we can add a prometheus data source by entering the address to the running instance, and then press “Build a dashboard”. inside the dashboard builder we import the interface file, to get something like this:
conclusions
so there you have it, visualization of your whole system in five easy steps. the main takeaway (as always with alembic) is that once we have the information about our system in ir, we can do a lot of neat things that otherwise would have taken a lot of bespoke scripting or data scraping.